
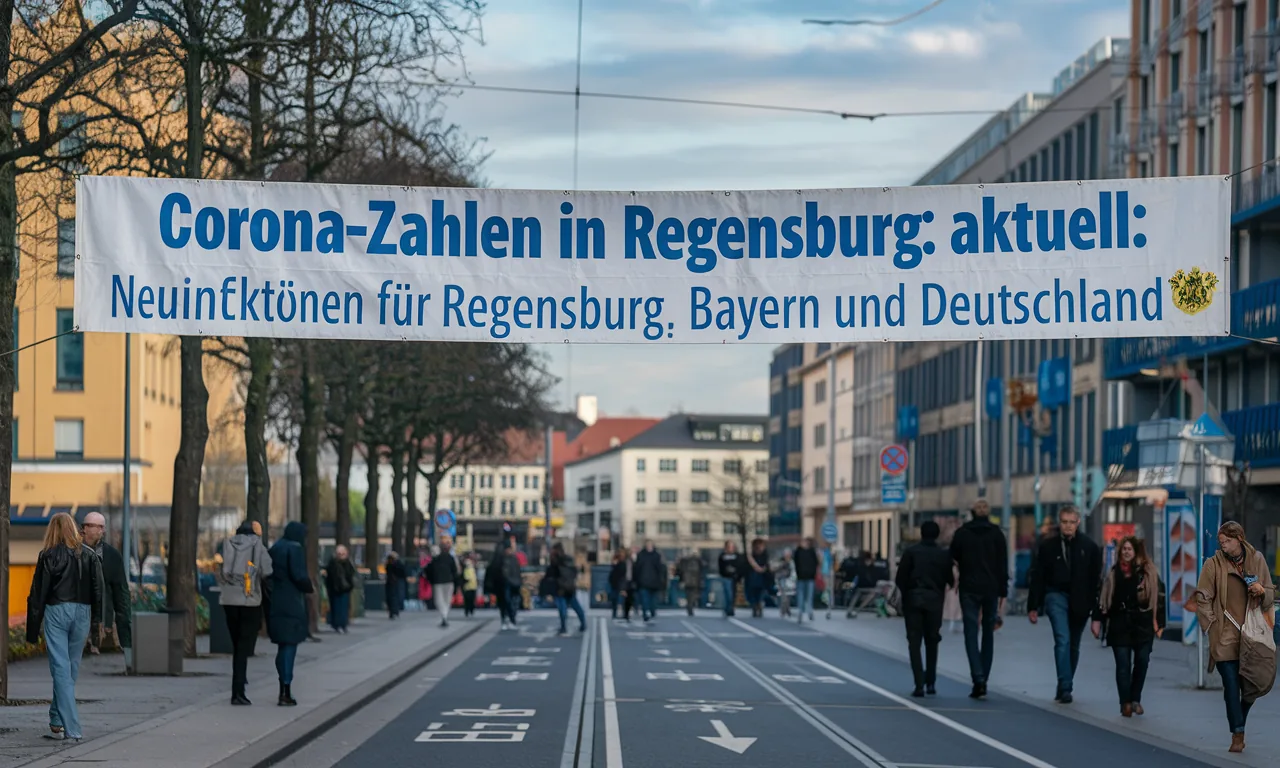
Corona Figures Regensburg Current: New Infections & Incidence
Corona Figures in Regensburg: Upcoming Releases and What You Should Watch Out For
This outlook explains when the next Covid-19 figures for Regensburg (city and district) are to be expected, how to check official sources, and how to interpret different data statuses between portals.
When are the next figures to be expected?
The Robert Koch Institute (RKI) and regional portals continuously update their datasets throughout the day. New reports may appear with a delay depending on when they are received from health authorities. Therefore, it is common for several data statuses to be published in one day.
- Multiple updates per day are possible (e.g., in the morning and later in the day).
- Figures for Regensburg (city) and the district often appear at different times.
- Minor discrepancies between portals are normal in the short term and usually balance out later.
How to check upcoming reports for Regensburg (city) and district
- Access RKI-based portals:
- Official RKI-based overviews for Regensburg (city) and the district.
- Statewide Bavaria overviews for context classification.
- Pay attention to the specified data status:
- Compare the time/date of the last update per portal.
- Note that later daily statuses may include further subsequent reports.
- Check key figures:
- Newly reported cases (daily increase).
- 7-day incidence (cases per 100,000 inhabitants in 7 days).
- Changed hospitalization and death figures, if indicated.
- Compare multiple sources:
- Use the more recent status (later time) as provisionally authoritative.
- Document the source and time if you reuse figures.
What do the key figures mean?
- New infections: Cases newly reported to the system since the last update. Subsequent reports can increase the daily number, even if they are not infections from the same day.
- 7-day incidence: Sum of reported cases over the last seven days per 100,000 inhabitants. Rounding differences may occur depending on the data status.
- Deaths related to Covid-19: Reports maintained by the RKI, which may be received with a delay.
Why do portals differ in new statuses?
Discrepancies are often due to these points:
- Different update times (earlier vs. later daily status).
- Subsequent reports from health authorities that are only integrated later.
- Rounding methods and population bases, which may vary slightly.
Tip: For consistent consideration, always use the same type of source (e.g., RKI-based portals) and compare statuses with as similar a timestamp as possible.
Classification of upcoming figures for Regensburg
- Observe the development over at least two to three consecutive daily statuses before deriving trends.
- Check city and district separately, as reporting paths and times differ.
- Relate local figures to Bavaria and national values to better assess the scale.
Quick Checklist for the Next Updates
- Is the source RKI-based? Timestamp noted?
- New infections, 7-day incidence, and deaths checked separately?
- Distinction made between city and district?
- Compared with state and national overviews?
- Discrepancies due to subsequent reports and rounding considered?
Notes on the use of the data
The published key figures serve public information. Short-term changes are possible if reports are received subsequently. For individual medical questions, please contact medical professionals.
Sources and Further Links
- BR Interaktiv – Corona Data Overview — RKI-based visualizations (accessed 2026-02-12)
- news.de – Corona Figures Tracker (RKI-based) — Daily reporting (accessed 2026-02-12)
- Corona-Zahlen-heute.de – Regensburg (City) — Municipal key figures (accessed 2026-02-12)
- Corona-in-Zahlen.de – Regensburg (City) — RKI-based analysis (accessed 2026-02-12)
- Corona-in-Zahlen.de – Regensburg District — RKI-based analysis (accessed 2026-02-12)
- inzidenz.info – Regensburg District — Overview and development (accessed 2026-02-12)